By
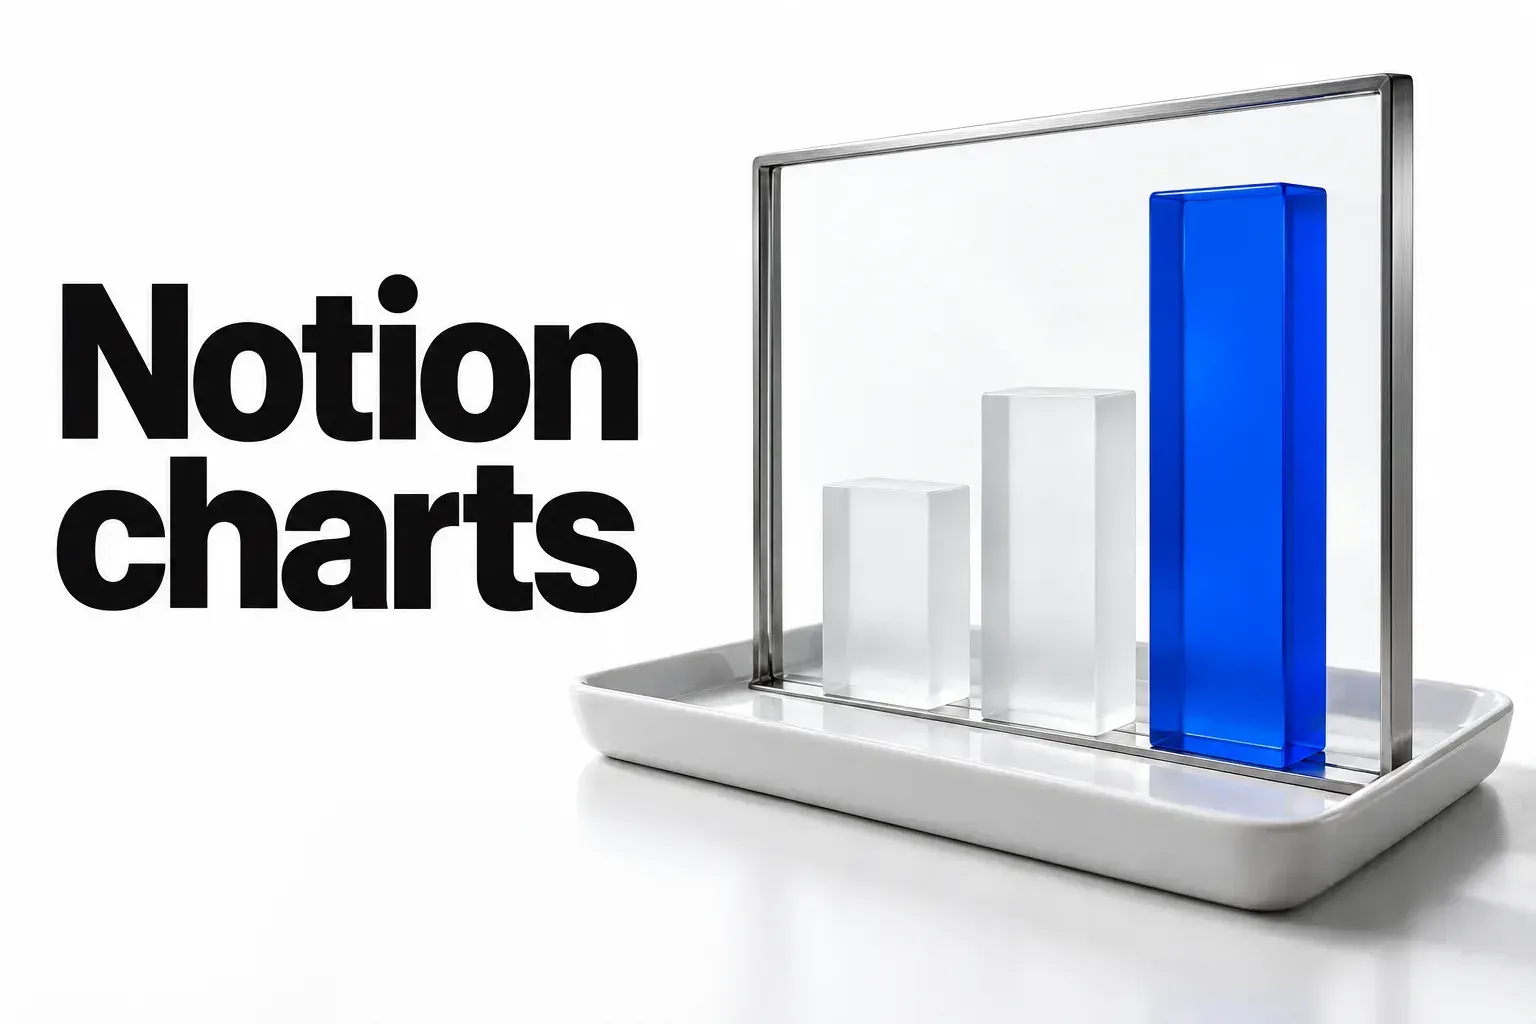
To make a chart in Notion, click + next to a database view's name and choose Chart, or type /chart on a page and link a database. Pick a vertical bar, horizontal bar, line, donut or number chart. For a bar or line chart, set what the X axis shows, such as Status, and whether the Y axis counts items or uses a number property; donuts use Data settings instead. On the Free plan you can create one chart, and paid plans get unlimited charts. A chart updates when its database changes, but you can't edit entries from chart view, so keep a table view beside it.
For counts by status, stage or client, choose a bar chart. For change over time, choose a line chart and turn on Cumulative when you want a running total. For the share of a whole, choose a donut and keep it to a few slices. If “notion graph” means a map of how your pages link to each other, that's a third-party connection called Graphify, and for a flowchart, use a Mermaid diagram inside a code block. I'd start with one bar chart on a database you already update, because a count by status exposes messy properties before you build anything bigger.
Which Notion chart fits your question?
Give each chart one question and one database. The chart type follows from the question:
- Vertical or horizontal bar chart: how many items sit in each status, stage, client or category. Add a Group by property to split each bar, for example status by task type.
- Line chart: how a count or a number changes over time, with a date property on the X axis. Our KPI tracker build uses one for a metric's trend.
- Donut chart: what share of the whole each part takes, such as open tasks by owner.
- Number chart: the fifth type in the
/chartmenu, for one headline figure instead of a breakdown.
Several charts in one place, data that lives outside Notion, a graph of linked pages, a flowchart and a Gantt schedule each take a different route, covered further down. The chart does the counting; picking the question that deserves a chart is still your call.

How do you create a chart in Notion?
Notion's chart help gives two routes. Use the first when a database already holds the data you want to see.
Add a chart view to a database
- Click + next to the name of your database or the name of the current view.
- Select Chart.
The chart becomes another view of the same database and works with the items already in it.
Add a chart to a page with /chart
- On any page, type
/chart. - Choose Vertical bar chart, Horizontal bar chart, Line chart, Donut chart or Number chart.
- Link an existing database, or select New chart to create a new database.
On a paid plan, you can repeat /chart on one page to show several databases, or one database several ways. Notion's guide to charts says they update automatically whenever the underlying data changes, so nobody has to copy numbers across by hand. You can also sort and filter the data a chart shows, for example to leave finished work out.
To switch types later, open the settings menu at the top right of the database and pick another type under chart type. You can't edit database entries from chart view, so keep a table or board of the same database for that. Our guide to choosing a Notion database view covers which one suits the editing work.
How do you set up the X and Y axes?
Open the settings menu at the top right of the database. X axis and Y axis settings exist only for bar and line charts; donut charts use their own Data settings.
X axis: what each bar or point stands for
- What to show: the property behind the groups, such as Status to show tasks by status.
- Sort by: the order of the groups, for example ascending status from to-do to complete.
- Visible groups: click the eye icon next to a group to hide it, such as completed tasks on a chart of work in progress. Hidden groups move to Hidden groups.
- Omit zero values: decides whether groups with no items, like a Paused status nothing sits in, appear on the chart. Depending on your setup, you may not see this option.
Y axis: what gets counted
- What to show: a property, or Count for the number of items in each X axis group.
- Group by: a property to group the Y axis by, such as task type, or None.
- Cumulative: appears when the chart shows Count or Sum and the X axis is sorted in ascending order. On, it shows the total gathered over time; off, each point shows only its own moment. In Notion's example, two tasks finished yesterday and three today read as 2 and 5 with Cumulative on, and 2 and 3 with it off.
Donut chart: slices instead of axes
Under Data, choose What to show, the property in Each slice represents, and Sort by. Visible groups work the same way as on bar charts. Hide or filter out minor groups until only a few slices remain, since a donut with many thin slices is hard to compare at a glance.
What a chart can't put on an axis
Axes can't show rollups, buttons, unique IDs, files and media, or formulas that return a list. Donuts exclude the same rollups, buttons, unique IDs, and files and media, plus “certain formulas.” For a numeric rollup, use a formula that returns one supported number and chart that formula property. List outputs remain excluded, and a formula does not make every unsupported property chartable. Notion warns that formulas based on relations or rollups can make a chart take a little longer to load. Our guide to relations and rollups shows where those values come from.
Two more limits shape what you can chart. A chart shows up to 200 groups and 50 subgroups at a time, which on a daily X axis means up to 200 day groups, and charts in large databases can be a little slower to update. If sub-items or sub-tasks don't show up, open the settings menu at the top of the database, choose More settings → Sub-items (or Sub-tasks) and set Show as to Flattened list. Our fix for a chart missing subtasks walks through it.
Before you style anything, check the data: a Status or Select property for the X axis, a number property or Count for the Y axis, and no rollup sitting directly on either axis. When a chart looks wrong, check the properties before the chart settings.

How do you change a chart's colors and labels?
Under Style, Color sets the palette, and More style options holds the rest:
- Height: from Small to Extra large.
- Grid line and Axis name: lines on the horizontal or vertical axis, and names for the X or Y axis.
- Data labels: a toggle that labels the points on bar and line charts; on a donut, a choice of how the slices are labeled.
- Smooth line and Gradient area: a curved line and a gradient fill under it, for line charts.
- Show value in center: the value in the middle of a donut.
- Color by value: darker colors for bigger values, on bar and donut charts whose color isn't Auto or Colorful.
- Legend: for line and donut charts.
I'd turn on Data labels and Axis name and leave the decoration off, because a client reading the chart in a status meeting needs the numbers and units, not a gradient. In the post announcing charts, Notion says its designers followed Edward Tufte's design principle against “chartjunk,” the “unnecessary and distracting embellishments that hinder the understanding of data.”
How do you read a chart and check the items behind it?
In an open chart, hover over any part to see its labels, and click a category in the legend to hide that group. Click a chart group, such as one bar, to open a drilldown: the items behind that part of the chart, shown as a table view. Drilldowns work on any chart you have permission to view.
- To change a property from a drilldown, open the page first. You still need permission to edit that page; chart-view access alone does not let you change its data.
- To keep a drilldown, click ••• at its top → Save as view in and pick a page.
- Inside a drilldown you can't select several rows for bulk actions, freeze columns, run calculations such as Count and Percent, or add new pages.
The drilldown is where you check the chart. I'd open one on the biggest bar before sharing any chart, because if it lists items you didn't expect, the problem is a filter or a property value, and no style setting will fix that.
How do you export or share a Notion chart?
- Open the settings menu at the top right of the database, then select Save chart as....
- Customize the background; a preview shows the result as you go.
- Choose Copy as PNG, Download PNG or Download SVG.
These options aren't available in the Android app. On a paid plan you can leave the background out, which also removes the Made with Notion watermark.
An image is a snapshot of the moment you saved it. For a slide, a client report or an email, choose PNG; choose SVG when someone wants a vector file for a design. For teammates who should see changes, copy the link to the chart instead. I'd send an image when an outside recipient needs a fixed report, after checking that its data is meant for them. The file doesn't carry Notion's access controls; a chart link is better for teammates who need live numbers and already have database access. When someone needs the rows rather than the picture, export the database instead.
How many charts do you get on the Free plan?
One. Members on the Free plan can try one chart, and everyone on a paid plan can create unlimited charts. Notion's pricing page lists Charts among the features the Plus plan adds to Free.
Three rules matter once that chart is in use:
- You can delete your free chart to create and use another.
- After you delete it, you need to create a new chart or duplicate an existing one in the workspace to use it for free. A template chart you download afterward needs duplicating before it works.
- If you download a template that contains several charts, you'll see only one of them, as long as you haven't used up your free chart.
On Free, I'd spend the chart on the question you check most often, such as open tasks by status, and keep everything else as numbers in the table. A formula progress bar gives each row a visual without using a chart.
How do you put several charts on one page?
On Business and Enterprise plans, use a Dashboard view. Notion's dashboard help gives two ways in: open a database and select + Add a new view → Dashboard, or type /dash on a page and choose Dashboard view. You can also have Notion Agent generate a first draft.
- A dashboard holds up to 4 widgets per row and 12 in total, and it can combine widgets from one database or several.
- Arrange widgets in Edit mode, and use View mode day to day so the layout stays put.
- Filters and sorts you set in View mode are stored locally, not saved to the dashboard, unless you choose Save for everybody, which needs edit permissions.
- For one filter across widgets, select the filter icon → Filter multiple sources. It only reaches widgets whose views include that property.
- The dashboard follows the database's permissions: changing the layout takes edit access, and view access opens it in View mode.
To keep it responsive, Notion suggests filtering each widget, for example to “This week” or “Status is not Done,” avoiding large unfiltered tables, and not putting several dashboard views on one page.
On Plus, put a few /chart blocks on one page. On Free, keep to one chart and arrange other inline database views in columns, which Notion's help also recommends when a page mixes rich text, images and several databases. Our personal dashboard build lays out a page like that. On Business or Enterprise, I'd choose the Dashboard view for anything a team checks every week, because separate Edit and View modes keep viewers from moving widgets by accident. On Plus, a page of linked charts is the practical stand-in.
How do you chart data that lives outside Notion?
Embed it. Notion's charts guide suggests embedding charts from tools such as Tableau, Mixpanel or Google Analytics next to your native charts. The steps in Notion's help on embeds are short: click + on a new line, choose Embed and paste the content's URL or embed link. Notion embeds content from over 1,900 domains through the Iframely service, and Iframely and the embedded app may receive the IP address of the people viewing it.
- A Failed to Load error means the site doesn't allow its content to be embedded elsewhere.
- Embeds that require a login to an external site don't work in Notion's desktop or mobile apps.
- Drag the black bars on the sides of an embed to resize it.
- When the source changes, the embed shows the change too.
To bring source data into a native chart, managed database syncs support GitHub and Jira on Business or the Mobile Business add-on, and Salesforce on Enterprise. The older GitHub, Jira, Asana and GitLab syncs stopped refreshing on October 30, 2026. A new managed sync creates new databases without migrating the old ones. Asana and GitLab need a Worker replacement. Synced properties are read-only in Notion, so correct their values in the source tool. Before sharing the chart, review the Notion database permissions: viewers do not inherit the source tool's access restrictions. Our synced databases guide covers that transition.
Chart-embed tools build a chart from your data and hand you something to embed: ChartBase, which sells chart embeds for Notion, says its charts update when you make changes in Notion, that it doesn't store your data and only accesses the tables you share, and that charts export as images or PDFs. A Google Sheets-based chart tool fills its charts from Sheets and tailors them to Notion embed blocks. Those are the vendors' own descriptions.
I'd keep native charts for anything already in a Notion database and use embeds only for data that lives in another tool, because a native chart stays inside Notion's permissions while a chart tool needs access to your tables. The embed shows the chart; deciding whether a third party should read your client data is still yours. Our Notion embed guide covers the embed block itself.
What if you want a graph of how your pages link?
That's a different tool. Graphify, a third-party connection listed in Notion's connection gallery, turns the pages you select into an interactive knowledge graph built from their @mentions, database relations and links. Its listing gives the steps:
Check the permissions before you connect it. The listing says it can read, insert and update the pages, databases and blocks shared with it, and that it reads basic profile details of workspace members and guests, including their email addresses. Notion's gallery also notes that connections not marked Made by Notion aren't supported or maintained by Notion. In a workspace with client pages, I'd share only the pages you want graphed, because this connection can change the content it sees, not only read it.
- Open Graphify and go to the Connections tab.
- Click Notion and connect your workspace.
- Select the pages you want in the graph.
- Go back to Graphify and click View Graph.
How do you make a flowchart in Notion?
Use a Mermaid code block. Type /mermaid for a code block with Mermaid formatting already applied, a shortcut listed in Notion's release notes. In any existing code block, select Mermaid in the language dropdown at the top left, then use the second dropdown to show a Preview of the chart, or Split to see code and chart together. The release that added Mermaid names flowcharts, pie charts and other diagrams among what it draws.
A small intake flow looks like this:
graph TD
    A[New inquiry] --> B{Fits our services?}
    B -->|Yes| C[Book a call]
    B -->|No| D[Send a referral]
Switch to Preview to see it drawn, then add steps one line at a time.
For a freehand sketch, embed a whiteboard instead: Excalidraw and Miro are among the apps Notion's embed help lists. There's also a flowchart template in Notion's marketplace if you'd rather start from a layout.
Notion's article on making a flowchart adds rules worth keeping: stick to a single page and split a large process into smaller charts, use one flow direction (top to bottom, left to right for US readers), review the chart often because processes change, and link out to the related process documents. For a process that changes with the work, I'd choose Mermaid, because the diagram is text you edit in place; for a freehand workshop sketch, choose an embedded whiteboard.
What about a Gantt chart?
A Gantt chart in Notion is the timeline view, not a chart view. Our timeline view guide sets one up from your project dates.
Why is your Notion chart wrong or missing something?
| Problem | Cause | Fix |
|---|---|---|
| A property is missing from the axis menu | Axes can't show rollups, buttons, unique IDs, files and media, or formulas that return a list | For a numeric rollup, use a formula that returns one supported number. For other excluded types, choose a supported category, date or number property |
| Sub-items or sub-tasks don't show | The database doesn't display them as a flattened list | More settings → Sub-items or Sub-tasks → Show as → Flattened list |
| The chart is slow to update | A large database, or formulas based on relations and rollups | Filter the chart to the items the question needs |
| Part of a long date axis is missing | A chart shows up to 200 groups and 50 subgroups at a time | Filter to a shorter date range |
| A status with no items appears or disappears | The Omit zero values setting | Switch Omit zero values the other way; some setups don't show it |
| You can't edit a task from the chart | Chart view doesn't edit entries | With permission to edit the page, use a table view or open the page from a drilldown |
| A template shows only one of its charts | On Free, you see one chart from a template | Keep the chart you need most, or move to a paid plan |
| A template chart won't open after you deleted your free chart | A new free chart has to be created or duplicated | Duplicate the template's chart |
| No PNG or SVG options in the Android app | Copy as PNG, Download PNG and Download SVG aren't in the Android app | Save the chart from a computer |
| The saved image carries a Made with Notion watermark | The watermark comes with the background | On a paid plan, save without a background |
| An embedded chart says Failed to Load | The site doesn't allow embedding | Paste the URL as a bookmark instead |
| An embed that needs a login won't load in the app | Embeds that need an external login don't work in Notion's desktop or mobile apps | Paste the URL as a bookmark, or use a source that needs no login |
| Dashboard filters reset for teammates | View-mode filters and sorts are stored locally | Choose Save for everybody, which needs edit permissions |
| A global filter skips one widget | That widget's view doesn't include the property | Filter that widget on its own |
What does Notion document for each chart route?
| Question | Chart or route | How | What Notion documents | Watch out |
|---|---|---|---|---|
| How many items sit in each status or category? | Vertical or horizontal bar chart | /chart or + → Chart; X axis What to show and Sort by; Y axis Count or a number property; Group by to split bars | X and Y axis settings exist only for bar and line charts | No rollup, button, unique ID, file or list-formula axes; up to 200 groups and 50 subgroups |
| How is something trending over time? | Line chart | A date property on X sorted ascending; Count or Sum on Y; Cumulative for a running total | Cumulative appears only for Count or Sum with an ascending X axis | A daily X axis shows up to 200 day groups, not necessarily 200 consecutive days |
| What share of the whole does each part take? | Donut chart | Data → What to show, Each slice represents, Sort by; Show value in center; Legend | No rollups, buttons, unique IDs, files and media or certain formulas; Color by value needs a color other than Auto or Colorful | Many thin slices are hard to compare; hide or filter minor groups |
| One headline figure | Number chart | /chart → Number chart | Listed in the /chart menu and the chart type list | Use it for one figure, not a breakdown |
| Several charts together | Dashboard view, or several /chart blocks on a page | + Add a new view → Dashboard, or /dash; Edit mode to arrange, View mode to use | Business and Enterprise; 4 widgets per row, 12 in total; permissions follow the database; View-mode filters stay local unless saved for everybody | Filter each widget; don't put several dashboard views on one page |
| A chart in a slide, doc or email | Save chart as... | Customize the background → Copy as PNG, Download PNG or Download SVG | Paid plans can drop the background and the Made with Notion watermark; not in the Android app | An image is a snapshot; copy the chart link for live numbers |
| Data that lives outside Notion | Embed, or a chart-embed tool | + → Embed and paste the URL; Tableau, Mixpanel or Google Analytics charts | Over 1,900 domains through Iframely; Failed to Load when a site blocks embedding; login embeds fail in the desktop and mobile apps | Embed tools are third-party products, and their sync and privacy claims are their own |
| A graph of how pages link | Graphify connection | Graphify → Connections → Notion → select pages → View Graph | Built from @mentions, relations and links; can read, insert and update shared content and reads member and guest emails; not supported or maintained by Notion | Share only the pages you want graphed |
| A flowchart or diagram | Mermaid code block, or an embedded whiteboard | /mermaid, or Mermaid in a code block's language dropdown, then Preview or Split; or embed Excalidraw or Miro | Mermaid draws flowcharts, pie charts and other diagrams inside a code block | One page, one flow direction |
| A Gantt-style schedule | Timeline view | A timeline view of the project database | A view, not a chart type | Covered in the timeline view guide |
Read across the rows and the pattern is plain: a native chart answers one question from one database, updates when the data changes and stays inside Notion's permissions. Its limits come from the shape of the data (no rollup, button, unique ID, file or list-formula axes, a cap of 200 groups, sub-items that need a flattened list) and from the plan (one chart on Free, Dashboard views on Business and Enterprise). Large sources and complex formulas can also slow updates. Everything that isn't a database chart, from outside data to page graphs, flowcharts and Gantt schedules, has its own route.
Which chart should you build first?
My verdict: chart only data that already lives in a Notion database, and make each chart answer one question. Bars count items by status or category, a line shows change over time with Cumulative for running totals, and a donut works only for a few parts of a whole. Clean the data before you style anything: a Status or Select property on the X axis, a number property or Count on the Y axis, no rollup or list formula on either, and sub-items set to Flattened list. On Free, spend the one chart on the question you check most. On Business or Enterprise, gather charts in a Dashboard view; on Plus, put a few linked charts on one page; on Free, combine the single chart with other database views. Save a PNG or SVG for slides and share the chart link when people need the live numbers. Reach for an embed only when the data lives elsewhere, a Mermaid code block for flowcharts and the timeline view for Gantt schedules.
To try it on a database you already use:
- Pick one database you update every week, such as tasks or client projects.
- Click + next to its view name and choose Chart.
- Set the X axis to its Status or category property and the Y axis to Count.
- Sort the X axis so the groups follow your workflow.
- Click the biggest bar to open its drilldown and check that the items are the ones you expect.
If the drilldown matches what you know about the work, keep that chart on Free or add a second on a paid plan. If it doesn't, fix the property values first.